Fen Topography

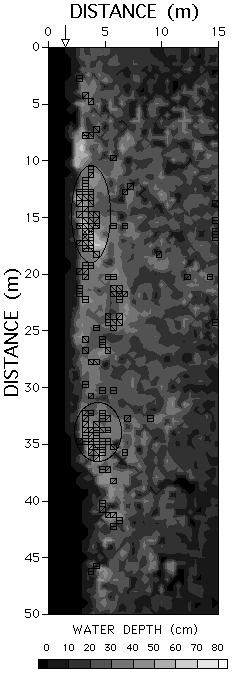
Topography of a 50 x 13.5 m fen divided into 2700 plots of 0.5 x 0.5 m, showing two dimensional water depths every 10 cm. Left black 50 x 1.5 m area (arrow) corresponds to the right bank. Fen tussocks are expressed by black (0 cm or less) and many blackish (1-10 cm) areas. Each square area represents a plot utilized for egg sac deposition of Salamandrella keyserlingii in 1995 (line from upper left to lower right), 1996 (line from upper right to lower left), and 1997 (horizontal centerline). Ellipses represent "hot spots" (communal breeding locations) in 1995 (upper) and 1996 (lower). Hot spots in 1997 separate into both these ellipses (Hasumi and Kanda, 1998).
Copyright 2002 Masato Hasumi, Dr. Sci. All rights reserved.
| Top Page | | Japanese |
